
Account: Demo
Developer Note
These top panels are combined totals of these metrics, for the advertiser, for the date range selected in the upper right date range picker.
Spend
$318k

3%
Developer Note
These percentage change indicators (as well as all throughout entire dashboard) show the % change based off the main date range selected verse the comparision date range selected in the top main date range picker.
Developer Note
Some panels have a "Widget Settings" panel that is opened via 3 dots in the upper right of the panel. In the settings the user can toggle "show only uniques" to filter by only unique users. And also "Conversion Window" which when toggled on reveals a numbers only input and days/hrs checkboxes to filter by.
Homepage
2.4m
Visits
3%
$5.50
CPA

4%
Checkouts
$52.3k
1,245Checkouts
3%
Developer Note
@BEN @JEFF how is ROAS calculated?
ROAS
36%
CPA
4%
Summary
Creative
Publisher
Channel
Audience
Developer Note
This is overall pacing. This is the only thing NOT based on the main date range picker. This should reflect the IO (selected in top filter) with its overall start / end date and total budget. Expected pacing got by dividing the budget evenly over the total amount of days. The large pacing number shown should be the percentage difference between the expected and actual.
Overall IO Pacing
Start
01/01/2021
End
03/31/2021
Budget
$400k
Spend
$318.4k
High Level Metrics
Developer Note
Note: Reach and frequency moved here instead of up in the first top panel.
Reach
1.6%
1.4m

Frequency
2.4%
4.03
Traffic Acquisition Cost
1.2%
$5.92

Homepage Uniques
1.2%
1.8m
Customer Acquisition Cost
1.4%
$26.73

Checkout Uniques
1.2%
43.2k
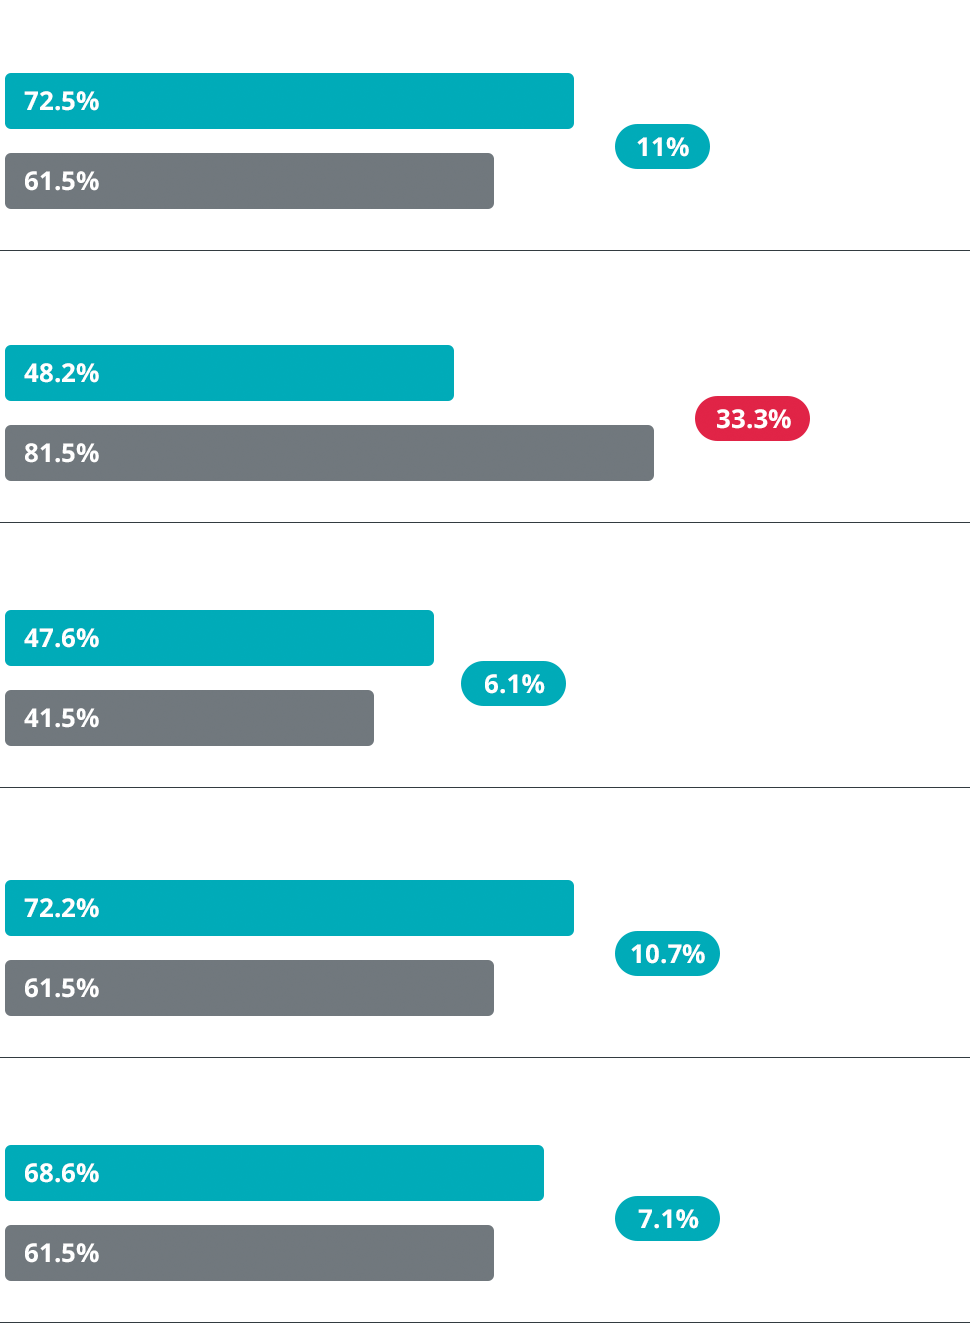
Overall Incremental Lift
8.6%
32.8%

Exposed Group Conversion Rate
3.1%
0.05%
Brand Lift
6.4%
19.5%

Survey Respondents
1.1%
43.1k


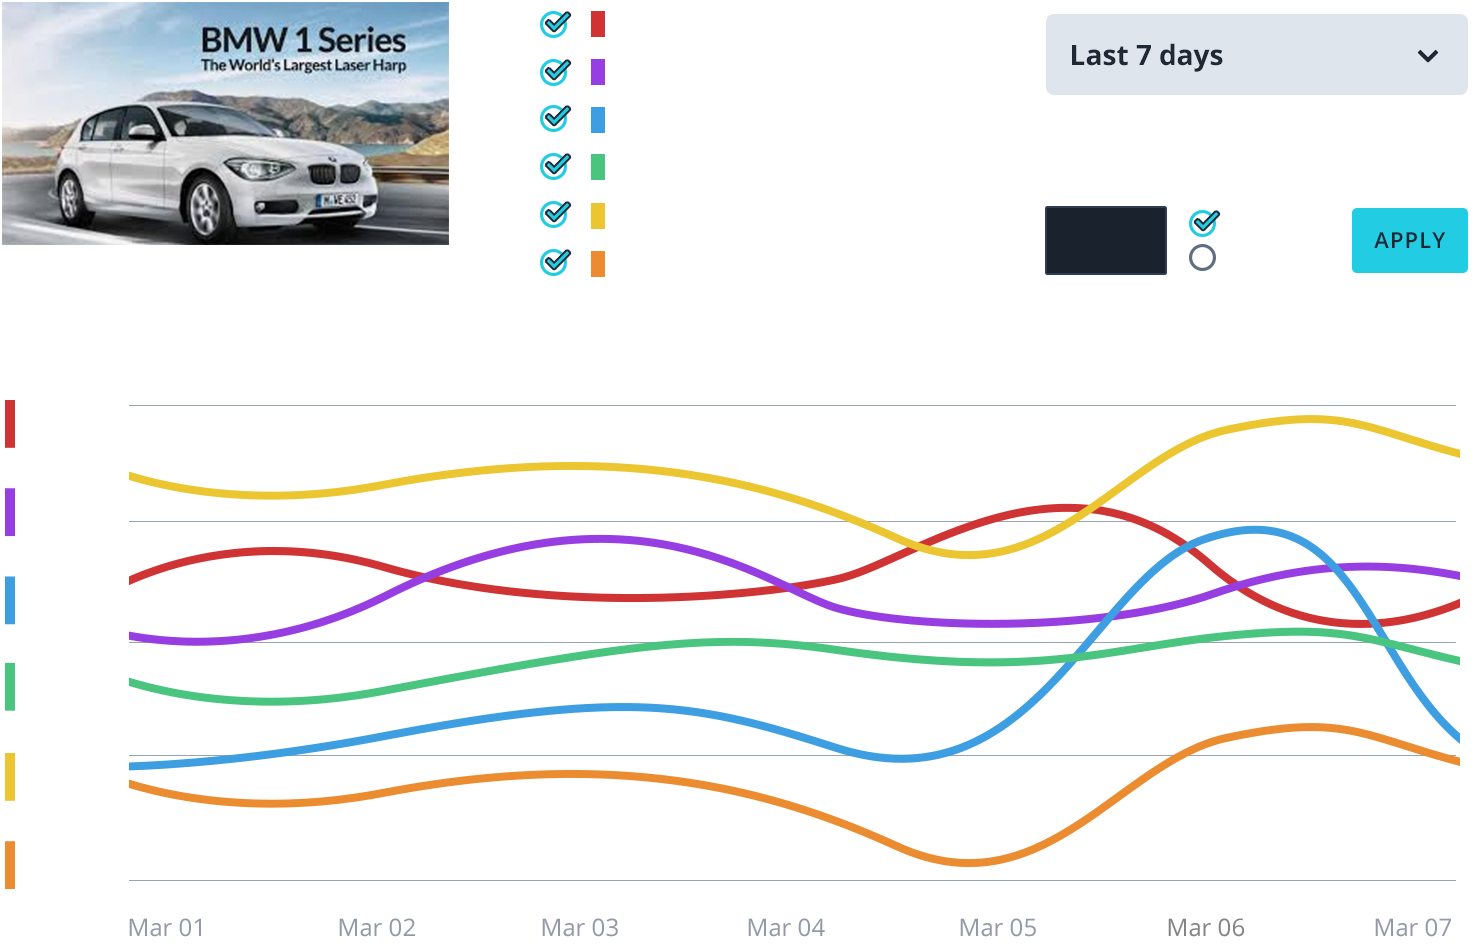
Daily View
Distribution
Brand Lift
Consumer Journey Analysis
Optimization
Impressions
Developer Note
If "Homepage Views" or "Checkouts" is selected it adds the 3 dots to the upper right of this panel to allow panel settings for these 2 options. All other options in the dropdown should hide and not apply these settings.
This logic is true for this dropdown in all tabs in this panel.
Developer Note
Comparision value based off the main date picker comparision date range set.
Impressions
13.9m
Date Range Total
12%
Impressions
12.6m
Compared Range Total